How big data helped one manufacturer make productivity gains

We live in the age of the internet, and more recently, ‘big data’. Big data is massive numbers of facts and figures that are so big and complex that it needs to be analysed by computer to extract meaning. With ongoing improvements in modern systems to handle big data, its application is becoming more widespread.
It seemed inevitable that manufacturing environments, in their quest for ever greater output and reduced waste, would be examined and put under the microscope. Handled correctly and with a proper computing system, big data can be analysed to provide business intelligence (BI) hereto unobtainable.
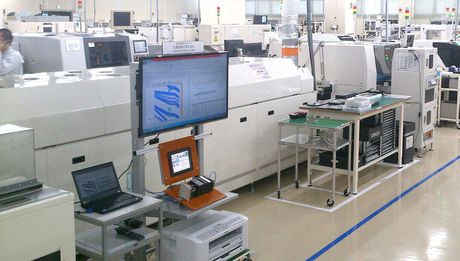
One place you would most expect to see this process of big data being collected by controllers, consolidated in a database and then analysed is on the production lines of the manufacturers who make these very products. This is precisely the case in one of Omron’s largest factories, in Kusatsu, Japan. Here, Omron’s Sysmac Machine Automation Controllers (MACs) not only control the manufacturing processes, their SQL client functionality serves real-time data collated from sensors in the field to an SQL server. The server then distributes this data for in-depth scrutiny.
The MACs were originally installed at Kusatsu as part of a continuous improvement program. Like so many factories, much information about production had come from informal, anecdotal reports by experienced operators on the plant floor. While a good deal of this information was correct, solid tangible evidence was needed in order to gain further productivity improvements.
As Masaru Takeuchi, general manager of Omron’s Automation Systems Division, said, “The experience and intuition of experts take a major role in improvement activities at production sites, but the improvement points that the experts cannot identify are hidden in the bottlenecks which hinder production efficiency. In order to overcome such situations and promote further improvements, we needed objective data.”
While similar concepts may have been tried in the past, the MACs provided several inherent advantages, namely, the lack of additional hardware. Data from the field already existed within the MAC, it was a matter of extracting it in an appropriate manner, using an off-the-shelf system that could present data flexibly enough to make it readily understood by all. SQL databases were the ideal choice, with a proven track record of performance with big data.
As the analysis needed to be done in real time, high speed was a prerequisite. By embedding SQL database client functionality within the controller and using its in-built Ethernet port as a direct link, rather than a third-party gateway, sufficient increases in speed could be achieved. The co-processing structure of the MAC ensured time-critical tasks, like servo updates, were unaffected.
One of the problems faced by the project team was how data collated by the server could be distributed effectively to the numerous parties that requested it. Each party was interested in very different aspects of the data, and extracted meaning in diverse ways. There was a preference for graphical formats, which can be visualised more quickly and also overcome any language barriers which may exist.

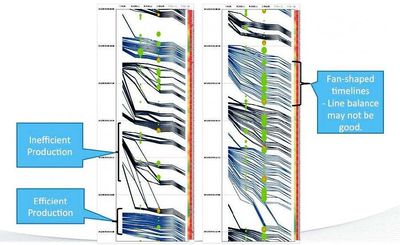
After some consideration, it was decided to use software from Microsoft, with an Excel front-end. The log data collected was converted into real-time charts for display on the site portal using Microsoft SharePoint Server, and exported to Microsoft Excel using PowerPivot for Excel. PowerPivot is a SQL Server add-in for Excel, which changes it into a BI tool to process more than one million records, all with Excel’s easy operability. Huge amounts of real-time data from the production line can be converted into graphs from various viewpoints and then analysed. Thus, instantaneous visualisation was provided to all employees for the entire process.
“Big data has existed for a long time in production lines, but the environment to use it effectively has not been created,” observed Takeuchi. “Data does not make sense until people who support production sites read and use the data. The environment to connect between data and people in the best way was necessary. Our Kusatsu factory has already used this data to understand the reality of production lines that could not be grasped by using only individual experiences and intuition.”
As Takeuchi remarked: “The challenge to improve never ends!”
Phone: 02 9878 6377
Emerson PAC Machine Edition 10.6 development environment
PAC Machine Edition 10.6 is an integrated development environment used to configure and manage...
NORDCON Windows v3.0 drive management software
NORD Drivesystems has released an updated NORDCON software version for Windows with a...
Belden PROVIZE Suite network management software
Belden has announced the release of its PROVIZE Suite, a network management software suite for...


