How to manage vaporisation in an analytical system
If the analyser in your analytical system requires gas but your sample is liquid, the only option is to convert the liquid to gas. This process is called vaporisation or flash vaporisation. The objective is to convert a sample of all liquid to all vapour instantly - without changing the composition.
It is not easy to vaporise a sample, nor is it always possible, so make sure it’s really necessary and possible before you try. You should always analyse a liquid in a liquid phase unless there are strong reasons for analysing in a vapour phase.
If you proceed with vaporisation, it’s important to understand the difference between evaporation and vaporisation. Evaporation occurs gradually with an increase in temperature. Vaporisation occurs instantly with a drop in pressure. It’s not possible to vaporise a sample by increasing temperature. Heat causes evaporation and adding more heat simply makes evaporation happen faster.
In a mixed sample, evaporation will allow some compounds to evaporate before others, resulting in fractionation. Vaporisation, done properly, ensures that all of the compounds vaporise at the same time, preserving the sample’s composition.
However, it is possible for things to go wrong when vaporising. Instead of flashing the whole sample into a vapour, you could unintentionally cause a combination of vaporisation and evaporation, resulting in fractionation. Once a sample of mixed compounds fractionates, it is no longer suitable for analysis. With fractionation, a common scenario is for lighter molecules to evaporate first and travel on towards the analyser, while the heavier molecules remain behind in the liquid phase. Even if at some later point in the process a fractionated sample appears to be all gas, the mixture will not be of the same molecular proportions as it was before fractionation. It will no longer accurately represent the product taken from the process line.
Let’s take a closer look at the process of vaporisation and how we can manipulate the variables - temperature, pressure and flow - to ensure proper vaporisation and an accurate analytical result.
Understanding vaporisation
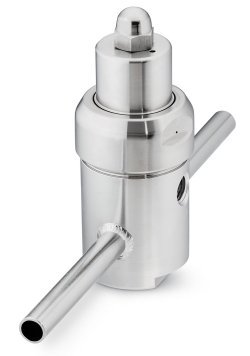
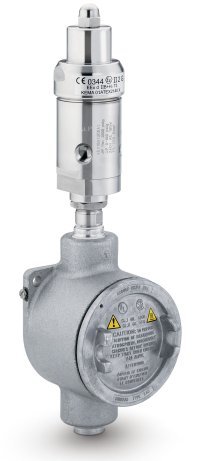
To vaporise a sample, one typically uses a vaporising regulator, also called a vaporiser, which is a pressure-reducing regulator with the capacity to transfer heat to the sample at just the right location.

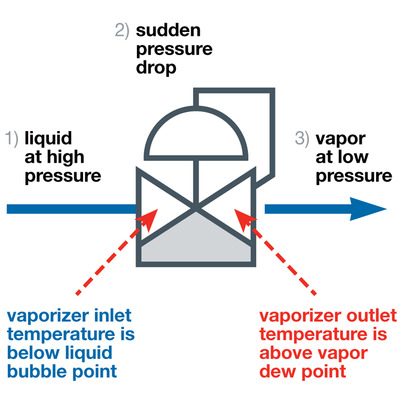
Vaporisation consists of a three-stage process (see Figure 1). First, the sample enters the vaporiser as a liquid. At this point, the liquid should not be bubbling or boiling.
Second, the liquid passes through the regulating orifice in the vaporiser, resulting in a severe and sudden pressure drop, which vaporises the liquid. At the same time, heat is applied, which enables the vaporised liquid to remain a vapour.
Third, the sample, now a gas, exits the vaporiser and travels to the analyser to be read. Due to the immediate transition to the vapour phase, the composition of the gas is unchanged from that of the liquid, ensuring an accurate reading.
In this delicate process, there are many variables or inputs that determine success or failure. For the purpose of this discussion, let’s say there are two main sets of inputs.
The first set of inputs concerns the composition of the sample. Depending on the composition of the sample, it will begin to bubble and finish vaporising at different pressures and temperatures. We’ll need to know what these pressures and temperatures are to successfully manage the process.
The second set of inputs concerns settings that you control in your sampling system: pressure, temperature and flow. Pressure and temperature are controlled at the vaporiser, while flow is controlled downstream at a rotameter (variable area flowmeter) and needle valve. We set these inputs based on what we know about the first set of inputs. Proper vaporisation requires a delicate balance of all inputs.
Even when approaching vaporisation in a systematic manner like this, the process does require some trial and error, so we’ll also talk about how to diagnose and address problems.
Understanding your sample
The best way to understand the first set of inputs is with a phase diagram. A phase diagram plots pressure and temperature, showing at any pair of conditions whether a substance will be vapour, liquid or solid. The lines indicate the interfaces between two phases.
Phase diagrams for most pure gases are available on the internet, for example, at http://encyclopedia.airliquide.com. But diagrams for gas mixtures are very difficult to create without commercial software.
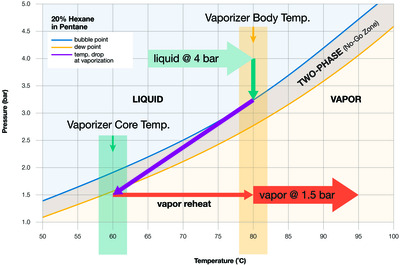
Figure 2 represents a phase diagram for 20% hexane in pentane. When the sample is above the bubble point (blue line), it’s all liquid. We want the sample to be all liquid when it enters the vaporiser. When the mixture is below the dew point (gold line), it’s all vapour. The sample must be all vapour when it leaves the vaporiser.

Between the bubble point and dew point lines is what we call the no-go zone. This zone is the boiling range of the sample. Here, the mixture is in two phases, part liquid and part vapour. Once a sample falls into the no-go zone, it is fractionated and no longer suitable for analysis. The objective in vaporisation is to set the temperature, flow and pressure so that the sample skips instantly from the liquid side of the no-go zone to the vapour side of the no-go zone.
With pure and nearly pure samples, there is little to no boiling range or no-go zone. The bubble point and dew point lines are on top of each other or nearly so. Indeed, pure and nearly pure samples will convert to vapour of the same composition, whether through evaporation or vaporisation. Some industrial samples approach this level of purity and convert easily.
On the other hand, some samples have such a wide boiling range or no-go zone that they cannot be successfully vaporised. There is no way to skip from the liquid side of the no-go zone to the vapour side of the no-go zone. We are unable to manipulate the variables - temperature, flow, and pressure - in such a way as to avoid fractionation.
Most samples fall between these two extremes. For example, in Figure 2, the band between bubble point and dew point is narrow enough that with the proper settings we can enable the sample to effectively skip from the liquid side of the no-go zone to the vapour side. At the same time, the band in Figure 2 is wide enough that we cannot afford to be careless. Indeed, we will need to be skilful in our manipulation of the variables or we will end up with a sample in the no-go zone.
Setting temperature, pressure and flow
Let’s continue to work with the sample in Figure 2 (20% hexane in pentane) and see how we can set our inputs to ensure successful vaporisation.
In general, at the inlet, we want high pressure and low temperature. At the outlet, we want high temperature and low pressure. But there are limits as to how high and low these parameters can be, and not all of them are under our control completely. Vaporisation is basically a balancing act between the variables.
Here is a four-step process for setting your inputs:
Step 1: Determine the inlet pressure at your vaporiser
This pressure, which is fixed, is your process pressure, provided your vaporiser is located close to your sample tap. In Figure 2, that pressure is 4 bar. Higher pressure is better because it allows you to keep the vaporiser temperature higher without boiling the incoming liquid.
Step 2: Set your inlet temperature, or the temperature of your vaporiser
There are two objectives. First, the temperature must be low enough that when the sample enters the vaporiser it is entirely a liquid and isn’t bubbling. In Figure 2, the bubble point at 4 bar is 88°C, but we want to build in a cushion, so let’s choose 80°C, a round number far enough away from 88°C to be safe.
The temperature must be high enough to contribute to the complete flashing of the sample, because when you vaporise the sample, the temperature drops, in accordance with the laws of energy conservation. The sample temperature must be high enough at the outset so that after the pressure drop the sample is not in the boiling range or no-go zone. In Figure 2, the vapour temperature after the pressure drop is 60°C, just on the vapour side of the dew point line.
Step 3: Set the outlet pressure at the vaporiser
Your objective is to drop the pressure below the gold dew point line. In Figure 2, the outlet pressure is set to 1.5 bar. If the outlet pressure were any higher in this example, the sample would fractionate.
Step 4: Set your flow
Flow is set downstream at a valve and rotameter, not at the vaporiser. In a sampling system, high vapour flow is desirable because it moves the sample to the analyser faster. However, high flow can be problematic too, because high flow results in a greater drop in temperature at the time of vaporisation. In Figure 2, the purple line illustrates the temperature drop. As flow increases, the purple line angles more sharply to the left.
Watching out for time delay
While fractionation is one problem in vaporising samples, another is time delay. Time delay - the amount of time it takes for a sample to travel from the process line to the analyser - is always a challenge when employing a vaporiser. The industry standard for time delay is one minute, but it can take many times longer if you’re not careful with your vaporiser set-up.

Time delay can be an issue on both the liquid and vapour side of the vaporiser. On the liquid side, the difficulty is caused by the sample’s degree of expansion when it is vaporised. A small amount of liquid creates a large amount of vapour. For example, the volume of methane increases about 600 times when it flashes from a liquid to a vapour. Hydrocarbons expand about 300 times.
With such a dramatic difference between the liquid and vapour volume, it’s easy for liquid on the upstream side of the vaporiser to be sitting around for a while before it is vaporised. For example, with a vapour flow of 600 mL/min, the liquid flow may be less than 2 mL/min.
If your vaporiser is located near the tap, the best solution to this problem is to install a bypass on the liquid side of the vaporiser, so the sample being vaporised is always fresh. In addition, try to minimise the volume of the probe and tubing preceding the vaporiser. Less volume results in a faster response.
To address time delay on the vapour side of the vaporiser, you may be tempted to increase flow, but as explained above, high flow in combination with insufficient heat at the vaporiser could result in fractionation, with liquid passing through the vaporiser to the downstream side.
A better way to reduce time delay on the vapour side is to minimise volume. For example, move the vaporiser closer to the analyser or build a fast loop on the liquid side.
Heat transfer in the vaporiser
Another variable influencing the temperature drop is the heat transfer capability of the vaporiser. Some vaporisers are constructed in such a way that heat transfers more efficiently to the sample. When the liquid sample converts to a vapour and its temperature drops, it draws heat from the stainless steel surrounding it. The critical question is: how efficiently can the vaporiser replace that heat and keep it flowing to the sample? The more heat the sample can draw, the less its temperature drops during vaporisation.

In some instances, it is possible for the vaporiser to be hot to the touch on the outside but cold at the core inside. That’s because the vaporised sample is drawing lots of heat and the vaporiser cannot transfer enough heat to keep up. The best solution is to reduce the flow.
In sum, the angle of the purple line in Figure 2 is a product of the flow rate and the heat transfer capability of the vaporiser. With a good vaporiser and low flow, the line will become more vertical. Unfortunately, there is no easy way to calculate the location of the purple line, and it is not generated by any known software program. As a result, vaporisation involves some approximation. As a rule of thumb, keep the flow rate as low as possible without causing an unacceptable delay in the sample’s travel time to the analyser. It’s better to start with a low flow rate and experiment with increasing it than to start with a higher flow rate.
Troubleshooting
Phase diagrams will enable you to approximate temperature, pressure and flow settings, but some troubleshooting will still be required. One sure indication of a problem is poor repeatability in analyser results.
There are two possibilities when the sample is fractionating instead of vaporising, with Problem 1 being the more common:
Problem 1: Only part of the sample is being vaporised
Liquid is passing through the vaporiser and sitting in the tubing on the downstream side. Eventually, it evaporates. When it does, it draws heat from the surrounding tubing, making the tubing cold to the touch or causing frost or ice to form.
- Signs of the problem: Vaporiser outlet and downstream tubing is cold to the touch or has frost or ice on it. (Note that in many cases, liquid on the downstream side of the vaporiser may pass beyond the area of the vaporiser and into other components, such as flowmeters and filters, where it can cause considerable damage.)
- Solution: In the approach above, your best option would be to reduce the flow rate. Another option would be to lower the vaporiser outlet pressure, if that is possible. A third option would be to increase the heat to the vaporiser, but in this case you risk causing Problem 2 (see below).
Problem 2: The sample is boiling at the inlet to the vaporiser
It is fractionating before it can be vaporised. Lighter molecules evaporate and create a ‘vapour wall’, which pushes the liquid back into the process. A portion of that vapour wall then cools and condenses. Finally, the liquid sample moves again towards the vaporiser, where the lighter molecules evaporate, starting the cycle all over again. Meanwhile, the heavier molecules move on towards the analyser for an inaccurate reading.
- Signs of the problem: The inlet tube to the vaporiser twitches, sometimes violently, and the measurement values oscillate.
- Solution: Lower the vaporiser temperature.
Conclusion
Vaporising a liquid sample is challenging. In many sampling systems around the world, vaporisers are fractionating samples and sending unrepresentative samples to the analyser every minute of every day. You can dramatically increase your chances of success by researching a phase diagram of your system’s particular mixture of compounds. You can further increase your chances of success by understanding what is occurring in the process - specifically, by knowing what the variables are (temperature, pressure and flow) and their role in influencing the process outcome. With this framework in place, you can come very close to the right settings, making adjustments in accordance with the signs and symptoms you observe.
Choosing an infrared temperature sensor
There are a number of factors that need to be considered when selecting an infrared temperature...
Optimising wastewater treatment through measurement
How digital measurement is helping to maximise wastewater treatment efficiency.
Money down the drain: The high cost of poor flow measurement in activated sludge treatment
Optimising aeration to control dissolved oxygen levels not only improves plant operation, but...


